Weekly Austin Real Estate Market Update

Austin Real Estate Weekly Market Update – September 04, 2025

by: Dan Price, Broker at Team Price Real Estate
Austin's leading data analysis brokerage, where data drives exceptional service
Published on: Thursday, September 04, 2025 at 08:03 am

The Austin housing market is moving into a new season of stability, with higher inventory and tempered price growth shaping the late summer landscape. Both the Austin-Area MLS and the City of Austin are carrying more listings than a year ago, and Months of Inventory has stretched higher, giving buyers more breathing room than in recent years. Prices, meanwhile, are holding relatively steady—posting only modest year-over-year gains—while still sitting well below the frenzied peak of 2022. Together, these trends paint the picture of a market that is neither overheated nor falling, but recalibrating into a more balanced environment where supply and demand are finally finding equilibrium. 

Image

Inventory Expansion Across the Region

Active residential listings across the Austin-Area MLS climbed to 16,993 in September 2025, a 5.3 percent increase from 16,136 one year ago. Months of Inventory expanded from 5.49 to 6.37, marking a 15.9 percent rise and reflecting 1.2 times more supply relative to the pace of current sales compared to last year. Within the City of Austin, the increase was even sharper. Active listings jumped 15.5 percent year over year, rising from 4,994 to 5,770. Months of Inventory moved from 5.94 to 6.71, a 13.0 percent increase. Both measures highlight the continued shift toward more balanced conditions, where buyers face greater choice and sellers encounter more competition.

Pricing Trends in the Austin-Area MLS

Price movements in the broader Austin-Area MLS were modest over the past year. The average list price for active homes increased 1.3 percent, from $584,337 to $592,068, while the median list price edged up just 0.2 percent to $439,990. On the sales side, prices also saw only slight gains. The average sold price rose 1.2 percent, reaching $570,182, and the median sold price increased 0.5 percent to $427,250. These results indicate that while inventory has expanded, pricing has largely leveled off, producing stability rather than significant upward or downward movement.

Stronger Price Performance in the City of Austin

Inside the City of Austin, pricing showed more strength than the regional average. The average list price increased 1.0 percent, from $809,283 to $817,461, while the median list price recorded a more notable 4.2 percent rise, climbing from $600,000 to $625,000. Closed sales confirmed this resilience, with the average sold price advancing 0.9 percent year over year to $782,069. The median sold price grew 2.7 percent, rising from $592,500 to $608,500. These results show that Austin’s urban core continues to support stronger pricing than the broader metro, even with higher levels of inventory.

Negotiation and Sold-to-List Ratios

Negotiation remains a defining characteristic of the market in 2025. So far this month, 69.24 percent of closed sales have transacted below list price, up from 65.95 percent last month. The share of homes selling at list price declined to 18.33 percent, down from 21.85 percent in August. Meanwhile, 12.43 percent of homes sold above asking, nearly unchanged from last month’s 12.20 percent but lower than the 13.24 percent recorded in July 2024. The average sold-to-list price ratio stands at 96.82 percent, underscoring that most buyers are securing discounts relative to asking prices.

Regional and ZIP Code-Level Insights

Market conditions remain mixed across Central Texas. Of the 30 tracked cities, 18 (60 percent) reported month-over-month price increases, while 12 (40 percent) recorded declines. On a year-over-year basis, 11 cities (37 percent) posted gains, while 19 (63 percent) experienced decreases. Importantly, none of the 30 tracked cities remain above their 12-month peak values.

At the ZIP code level, 37 out of 75 tracked areas (49 percent) reported month-over-month increases, while 35 (47 percent) showed declines. On a year-over-year basis, 31 ZIP codes (41 percent) posted gains, while 44 (59 percent) recorded losses. Only one ZIP code has exceeded its 12-month high, with the remaining 74 still below their peak levels. These figures confirm that recovery is uneven, with localized differences shaping outcomes for sellers and buyers.

Prices Relative to Peak Levels

Both the Austin-Area MLS and the City of Austin remain well below their peak valuations. Across the MLS, the average list price is down 12.3 percent from its March 2023 high, while the median list price has dropped 18.5 percent from its May 2022 peak. The average sold price is 14.1 percent below May 2022 levels, and the median sold price has fallen 20.1 percent. On a price-per-square-foot basis, both average and median values are 21 to 24 percent lower than their peaks.

Within the City of Austin, pricing has also declined from highs. The average list price is down 14.7 percent from its April 2024 peak, while the median list price has fallen 16.5 percent from May 2022 levels. The average sold price is 8.8 percent below its May 2022 peak, and the median sold price is 13.2 percent lower. Price-per-square-foot measures in Austin are down 21 to 24 percent compared to their peak values.

Market Outlook

The Austin housing market at the start of September 2025 reflects a phase of stabilization. Inventory continues to expand, absorption is slower than last year, and negotiation is widespread. Yet, pricing remains higher than in 2024, with the City of Austin showing greater resilience than the broader MLS. At the same time, all markets remain well below peak valuations from 2022 and 2023. The result is a balanced environment defined by fundamentals rather than extremes—buyers gain leverage through choice and negotiation, while sellers who price accurately continue to achieve successful closings.

Austin Area Residential Sales Insights

Austin Housing Market Questions People are Asking:

Are Austin home prices falling?

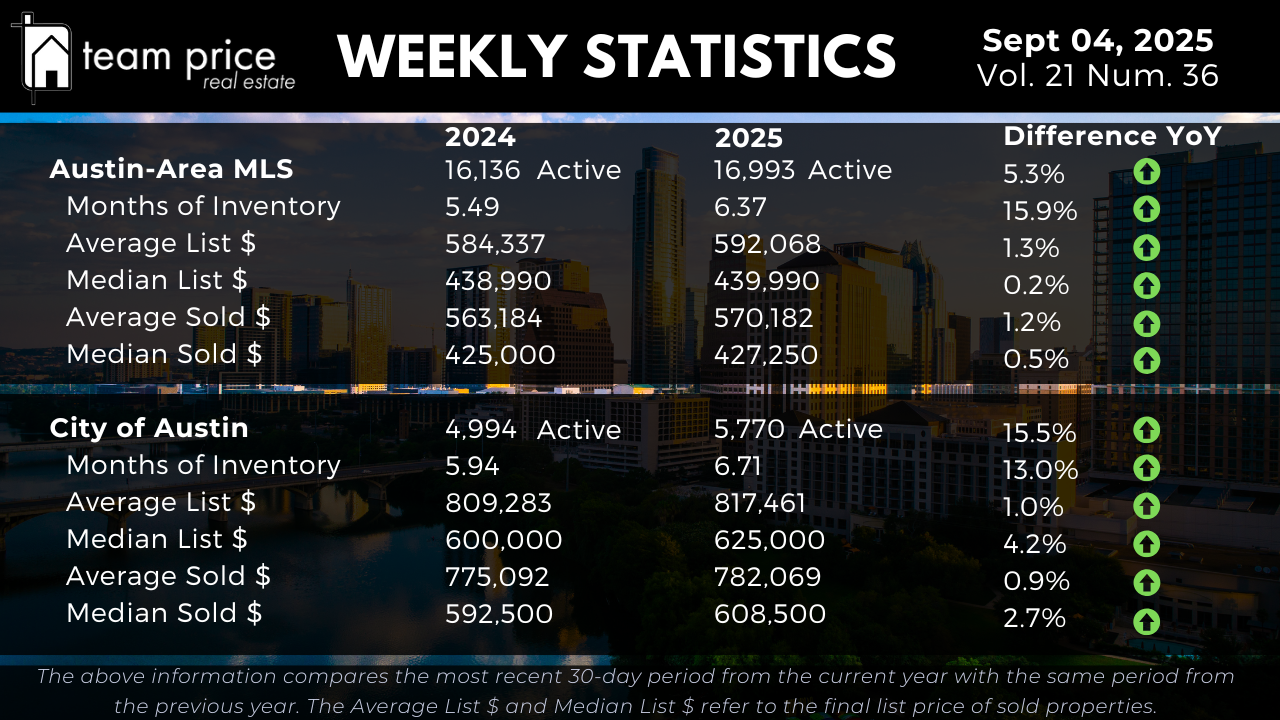
Compared to last year, home prices in the Austin-Area MLS have not fallen. The average sold price rose 1.2 percent from $563,184 in 2024 to $570,182 in 2025, and the median sold price increased 0.5 percent from $425,000 to $427,250. In the City of Austin, the average sold price rose 0.9 percent to $782,069, while the median sold price grew 2.7 percent to $608,500. However, when measured against peak values from 2022 and 2023, prices remain significantly lower. For example, the Austin-Area MLS median sold price is 20.1 percent below its May 2022 high, and the City of Austin median sold price is 13.2 percent below its May 2022 peak.

Is it smart to buy a house in Austin right now?

The data shows that inventory has expanded, giving buyers more options. Active listings in the Austin-Area MLS increased 5.3 percent year over year to 16,993, while Months of Inventory rose from 5.49 to 6.37. In the City of Austin, inventory rose 15.5 percent to 5,770 listings, with Months of Inventory increasing to 6.71. Negotiation is also widespread, as 69.24 percent of homes sold so far this month have closed below list price, and the average sold-to-list ratio stands at 96.82 percent. These numbers indicate that buyers have more leverage in 2025 compared to last year.

What is the real estate market in Austin 2025?

The Austin housing market in 2025 is characterized by higher supply and modest year-over-year price gains. Regionally, the average list price increased 1.3 percent to $592,068, while the median list price was nearly flat at $439,990. In the City of Austin, the average list price rose 1.0 percent to $817,461, and the median list price increased 4.2 percent to $625,000. Across Central Texas, conditions vary: 60 percent of tracked cities posted month-over-month price increases, while 40 percent showed declines. At the ZIP code level, 49 percent reported monthly gains and 47 percent posted losses.

Is housing going to get cheaper in 2025?

Compared to last year, housing prices are slightly higher in both the Austin-Area MLS and the City of Austin. However, compared to historic peaks, prices remain substantially lower. For example, in the Austin-Area MLS, the median sold price is 20.1 percent below its May 2022 peak, and the average sold price per square foot is down 21.9 percent. In the City of Austin, the median sold price is 13.2 percent below peak levels, and the average sold price per square foot has declined 21.5 percent. This shows that while prices are not falling year over year, they remain well below prior highs.

What is the latest update on the Austin housing market?

As of September 2025, active listings in the Austin-Area MLS reached 16,993, a 5.3 percent increase from last year. Months of Inventory rose to 6.37, up from 5.49. In the City of Austin, inventory expanded 15.5 percent to 5,770 listings, with Months of Inventory at 6.71. Pricing has been stable, with modest year-over-year gains: the regional median sold price increased 0.5 percent to $427,250, while the City of Austin median sold price rose 2.7 percent to $608,500. Negotiation remains common, with nearly 70 percent of homes selling below list price. Regionally, 63 percent of cities and 59 percent of ZIP codes reported year-over-year price declines, showing that while the overall market is stable, conditions vary widely at the local level.​

Latest Articles


No articles found.